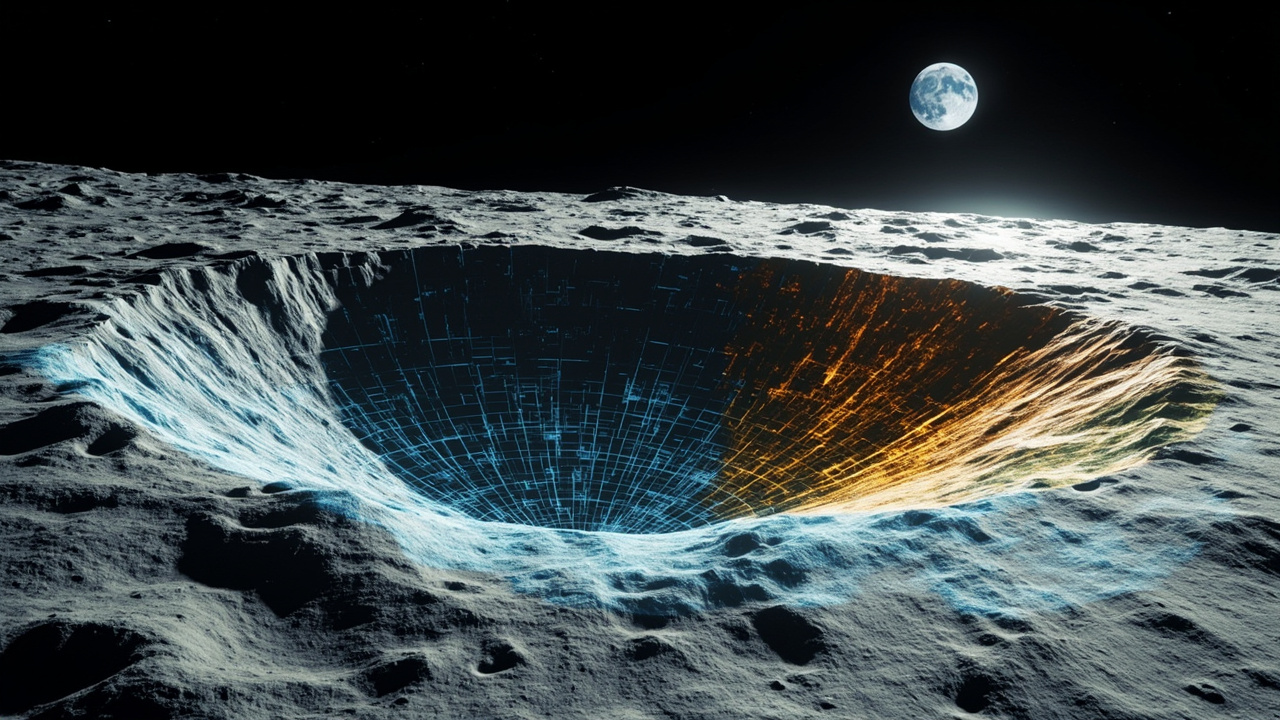
TL;DR: NASA and IBM on Sept. 10, 2026 released the NASA-IBM Lunar Foundation Model, an open-source AI system trained on about two million lunar image tiles to map craters, young volcanic features and potential polar ice.
NASA and IBM have released an open foundation model built to read the Moon at scale. The announcement, made Sept. 10, 2026 from Yorktown Heights, N.Y., introduces the NASA-IBM Lunar Foundation Model as one of the first publicly available foundation models created specifically for lunar science, according to the IBM newsroom.
The release turns decades of orbital measurements into a reusable tool for researchers. Instead of requiring teams to build a new algorithm for every mapping job, the pre-trained system can be fine-tuned with small amounts of labeled data for different investigations, according to NASA Science. The model is hosted publicly on Hugging Face for anyone to use, with complete code available on GitHub for testing and experimentation.
What was announced on Sept. 10
The partners described the system as a foundation for discovery that connects patterns across instruments at a scale no single sensor has provided. The IBM newsroom said the model was trained on an extensive lunar observation dataset curated by IBM and NASA researchers, with the goal of helping scientists convert complex, multi-instrument records into insights that support a sustained human presence on the Moon.
According to NASA Science, the effort is an ongoing collaboration involving IBM Research and several academic institutions. The agency framed the work as a data-access challenge as much as a modeling challenge after decades of lunar collection.
“NASA has spent decades building an extraordinary scientific record of the Moon, but collecting data is only part of the job,” said Kevin Murphy, chief science data officer and acting chief data and AI officer at NASA Headquarters in Washington, as quoted by both NASA Science and the IBM newsroom. “We also have to make data easier for scientists to explore and use.”
IBM Research Europe leadership offered a parallel assessment. “Uncovering the mysteries of the Moon requires an ability to learn from an extraordinary volume of scientific data,” said Juan Bernabe-Moreno, Director of IBM Research Europe, UK and Ireland, according to the IBM newsroom. He said the system gives scientists a foundation to explore the Moon at scale and provides an open platform the global research community can build on.
Why lunar mapping needed a new approach
For decades, sensors have watched the Moon and produced petabytes of measurements, but analysis often meant manual inspection of maps and images or use of low-resolution, task-specific machine learning models, according to the IBM newsroom. Those approaches can be computationally intensive and may lack the scientific accuracy needed to identify geographic features.
The Moon compounds the problem. Its topography includes craters, distributed ice deposits and traces of past volcanism, all recorded by different instruments at different resolutions. According to IBM Research, NASA’s Gravity Recovery and Interior Laboratory mapped the gravity field at about 20 kilometers per pixel to reveal crust and subsurface structure, while NASA’s Lunar Reconnaissance Orbiter imaged boulders and crater rims at about 1 meter per pixel while searching dark polar craters for ice.
Lighting adds another complication. A lunar day brings roughly two weeks of sunlight followed by two weeks of darkness, and the lack of a thick atmosphere produces sharp shadows and bright glare, according to IBM Research. At the poles, the Sun stays low on the horizon, throwing long shadows that can hide rocks, craters and other hazards. Surface dust and rock called regolith can further distort appearance depending on Sun angle.
Temperature extremes widen the need for better maps. IBM Research reported daytime highs around 250°F (121°C) in full Sun and lows around minus 410°F (minus 246°C) in shadowed craters. Scientists generally know where extremes occur, but higher-resolution guidance could help identify ice or safer locations for a base.
Training data: 17 years of orbital observations
Data from NASA’s Lunar Reconnaissance Orbiter over the past 17 years was central to training because it covers most of the surface in detail, according to NASA Science. The LRO record is larger than all other NASA planetary missions combined and forms an almost seamless, high-resolution mosaic of the entire Moon.
The training set comprised roughly 2 million image tiles, including more than 1 million high-resolution camera images at 1-meter resolution and nearly 964,000 multispectral images at 100-meter resolution, according to NASA Science. The model also used high-resolution imagery and terrain data from NASA’s GRAIL mission, NASA’s Lunar Prospector and the Japan Aerospace Exploration Agency’s Selenological and Engineering Explorer.
Alongside the model, IBM and NASA scientists built what they described as the first open-source lunar dataset of its kind: a unified, machine-learning-ready collection aggregating more than 30 spatially aligned layers from nine instruments across four missions, according to the IBM newsroom. That dataset combines tens of thousands of images and maps showing geophysical properties from LRO and GRAIL with complementary data from Japan’s SELENE/Kaguya mission.
According to Live Science, researchers organized the benchmark portion of that work under the name SomBench, made up of nearly 2 million overlapping map patches called tiles. Lower-resolution layers supply wide overviews plus ultraviolet reflectance and elevation information, while high-resolution layers combine detailed camera views with meter-scale terrain, slope and orientation maps, plus thermal, mineralogical and gravity-anomaly readings.
Architecture built for multiple sensors
IBM and NASA described the system as the first lunar AI model to integrate observations captured across modalities, viewing angles and spatial scales into one representation, according to IBM Research. The team adapted a version of TerraMind, an Earth-observation model developed by IBM and the European Space Agency, selected for its ability to integrate different data types and resolutions and learn relationships across modalities.
Training used masked-token learning, in which parts of a dataset are hidden and the system must fill in the missing information, according to Live Science. During training, the model might receive part of a lunar tile, such as visible-light appearance and elevation, and then predict concealed information across millions of examples. That process teaches relationships among lighting, terrain structure and physical geography.
Lighting information was supplied explicitly rather than left for the model to infer only from shadows. Researchers provided metadata describing solar angles and spacecraft positions, allowing the system to devote more capacity to recognizing terrain rather than being misled by shadows, according to Live Science. A technical paper describing the work was shared with Live Science on Sept. 10.
Three priority science tasks
NASA initially prioritized three applications: mapping smaller uncatalogued craters, investigating volcanic history and searching polar craters for ice, according to IBM Research. All three relate to both science and planning for long-term surface operations.
Searching for stable ice near the poles
Permanently shadowed regions are among the most difficult lunar environments to observe, yet they may hold ice below the surface, according to the IBM newsroom. Such ice indicates water and oxygen, resources described as essential for a future Moon base and for producing rocket fuel for future missions to Mars.
For polar-ice studies, the model can help estimate where ice patches are likely to be stable on and below the surface, according to NASA Science. Dark permanently shadowed areas remain cold enough to trap and preserve ice for up to billions of years. Studying those zones offers insight into lunar history and a route to mapping potentially usable resources for future exploration.
NASA Science illustrated the capability with ice-prospectivity patterns near the pole, including Mons Mouton near the lunar south pole, showing reference maps alongside predictions from the NASA-IBM model and a ConvNeXt model. The agency said the NASA-IBM system preserved many fine-scale patterns in the reference data. Live Science reported that the ice evaluation focused on prospectivity within the top meter of regolith.
Tracing young volcanism
Scientists study features called irregular mare patches to understand volcanic history and thermal evolution, according to the IBM newsroom. Although the Moon is thought to be no longer volcanically active, it once experienced dynamic processes, and these relatively young-looking structures challenge established timelines for lunar cooling, according to NASA Science.
Mapping those features could help reconstruct the Moon’s thermal evolution, while identifying changing regions is also strategic for future surface operations. NASA Science described Mons Rümker and surrounding mare plains, shown in a 10-image mosaic from the Lunar Reconnaissance Orbiter Narrow Angle Camera captured between June 2012 and April 2016, as an example of the volcanic landscapes researchers want to understand.
Counting and measuring craters
Craters are among the most distinctive lunar features and provide clues about terrain age, geology and the chemistry of the early lunar interior, according to the IBM newsroom. Crater mapping also helps select safe landing sites, avoid hazards such as steep slopes and boulders, and plan long-term infrastructure.
Every crater records an impact, so counts and measurements are essential for dating the surface and reconstructing solar system history, according to NASA Science. The foundation model is intended to speed identification and measurement so scientists can concentrate on interpretation and exploration implications.
In one demonstration, Lunar Reconnaissance Orbiter images near Einstein crater showed the surface before and after an impact by a SpaceX rocket body, according to NASA Science. The model detected existing craters and highlighted the newly formed crater. Because the post-impact image had been excluded from pre-training, the test showed how fine-tuning could recognize novel surface changes and help automatically detect natural impacts.
Reported performance gains
The IBM newsroom said the model exceeds widely used methods by up to 22% in identifying key geographic features, including potential ice deposits, craters and volcanic formations.
For ice, a NASA-IBM technical paper reported that the system reduced error in identifying high-potential ice areas by up to 22% compared with the SwinV2-B ImageNet model, as measured by root-mean-square error. For volcanic features, using imperfect labels, it captured the extent of irregular mare patches 3% better than SwinV2-B, with comparable accuracy but greater efficiency and lower fine-tuning costs.
For craters, the paper reported comparable accuracy to state-of-the-art models such as SwinV2-B at meter-scale resolution, again with greater efficiency and lower fine-tuning costs. At context-scale resolution near 100 meters, it outperformed SwinV2-B by nearly 19% while using half the training data. Live Science similarly reported the nearly 19% crater-detection advantage with half as many training labels.
Open release and Artemis context
The partners emphasized open access. In addition to Hugging Face hosting and GitHub code, the unified dataset is intended as a common framework for machine learning on multi-modal, multi-resolution lunar data, which the IBM newsroom said had not previously existed in publicly available form.
IBM Research placed the work in the context of NASA’s Artemis program, now underway to test whether people can live and work on the Moon. The agency’s long-term vision involves a lunar base for research, technology testing and preparation for Mars. A detailed map is especially important on rugged terrain, and future crews could use ice-derived drinking water, oxygen and fuel.
The model extends an established IBM-NASA collaboration that converts scientific data into openly available tools for the research community, according to the IBM newsroom. By releasing both model and dataset, the organizations said scientists worldwide can adapt the system to new lunar questions without starting from scratch.
Sources referenced
- NASA, IBM Launch AI Foundation Model for Lunar Science - NASA Science (https://science.nasa.gov/science-research/artificial-intelligence-lunar-foundation-model/)
- IBM and NASA Release Open-Source AI Model to Support Lunar Exploration (https://newsroom.ibm.com/2026-09-10-ibm-and-nasa-release-open-source-ai-model-to-support-lunar-exploration)